

orch-monitor web dashboard
orch-monitor is a Bun-based HTTP server that aggregates worker signal files, polls GitHub for PR state, and serves a live dashboard with server-sent event streams. One process powers both the web UI and the terminal UI.
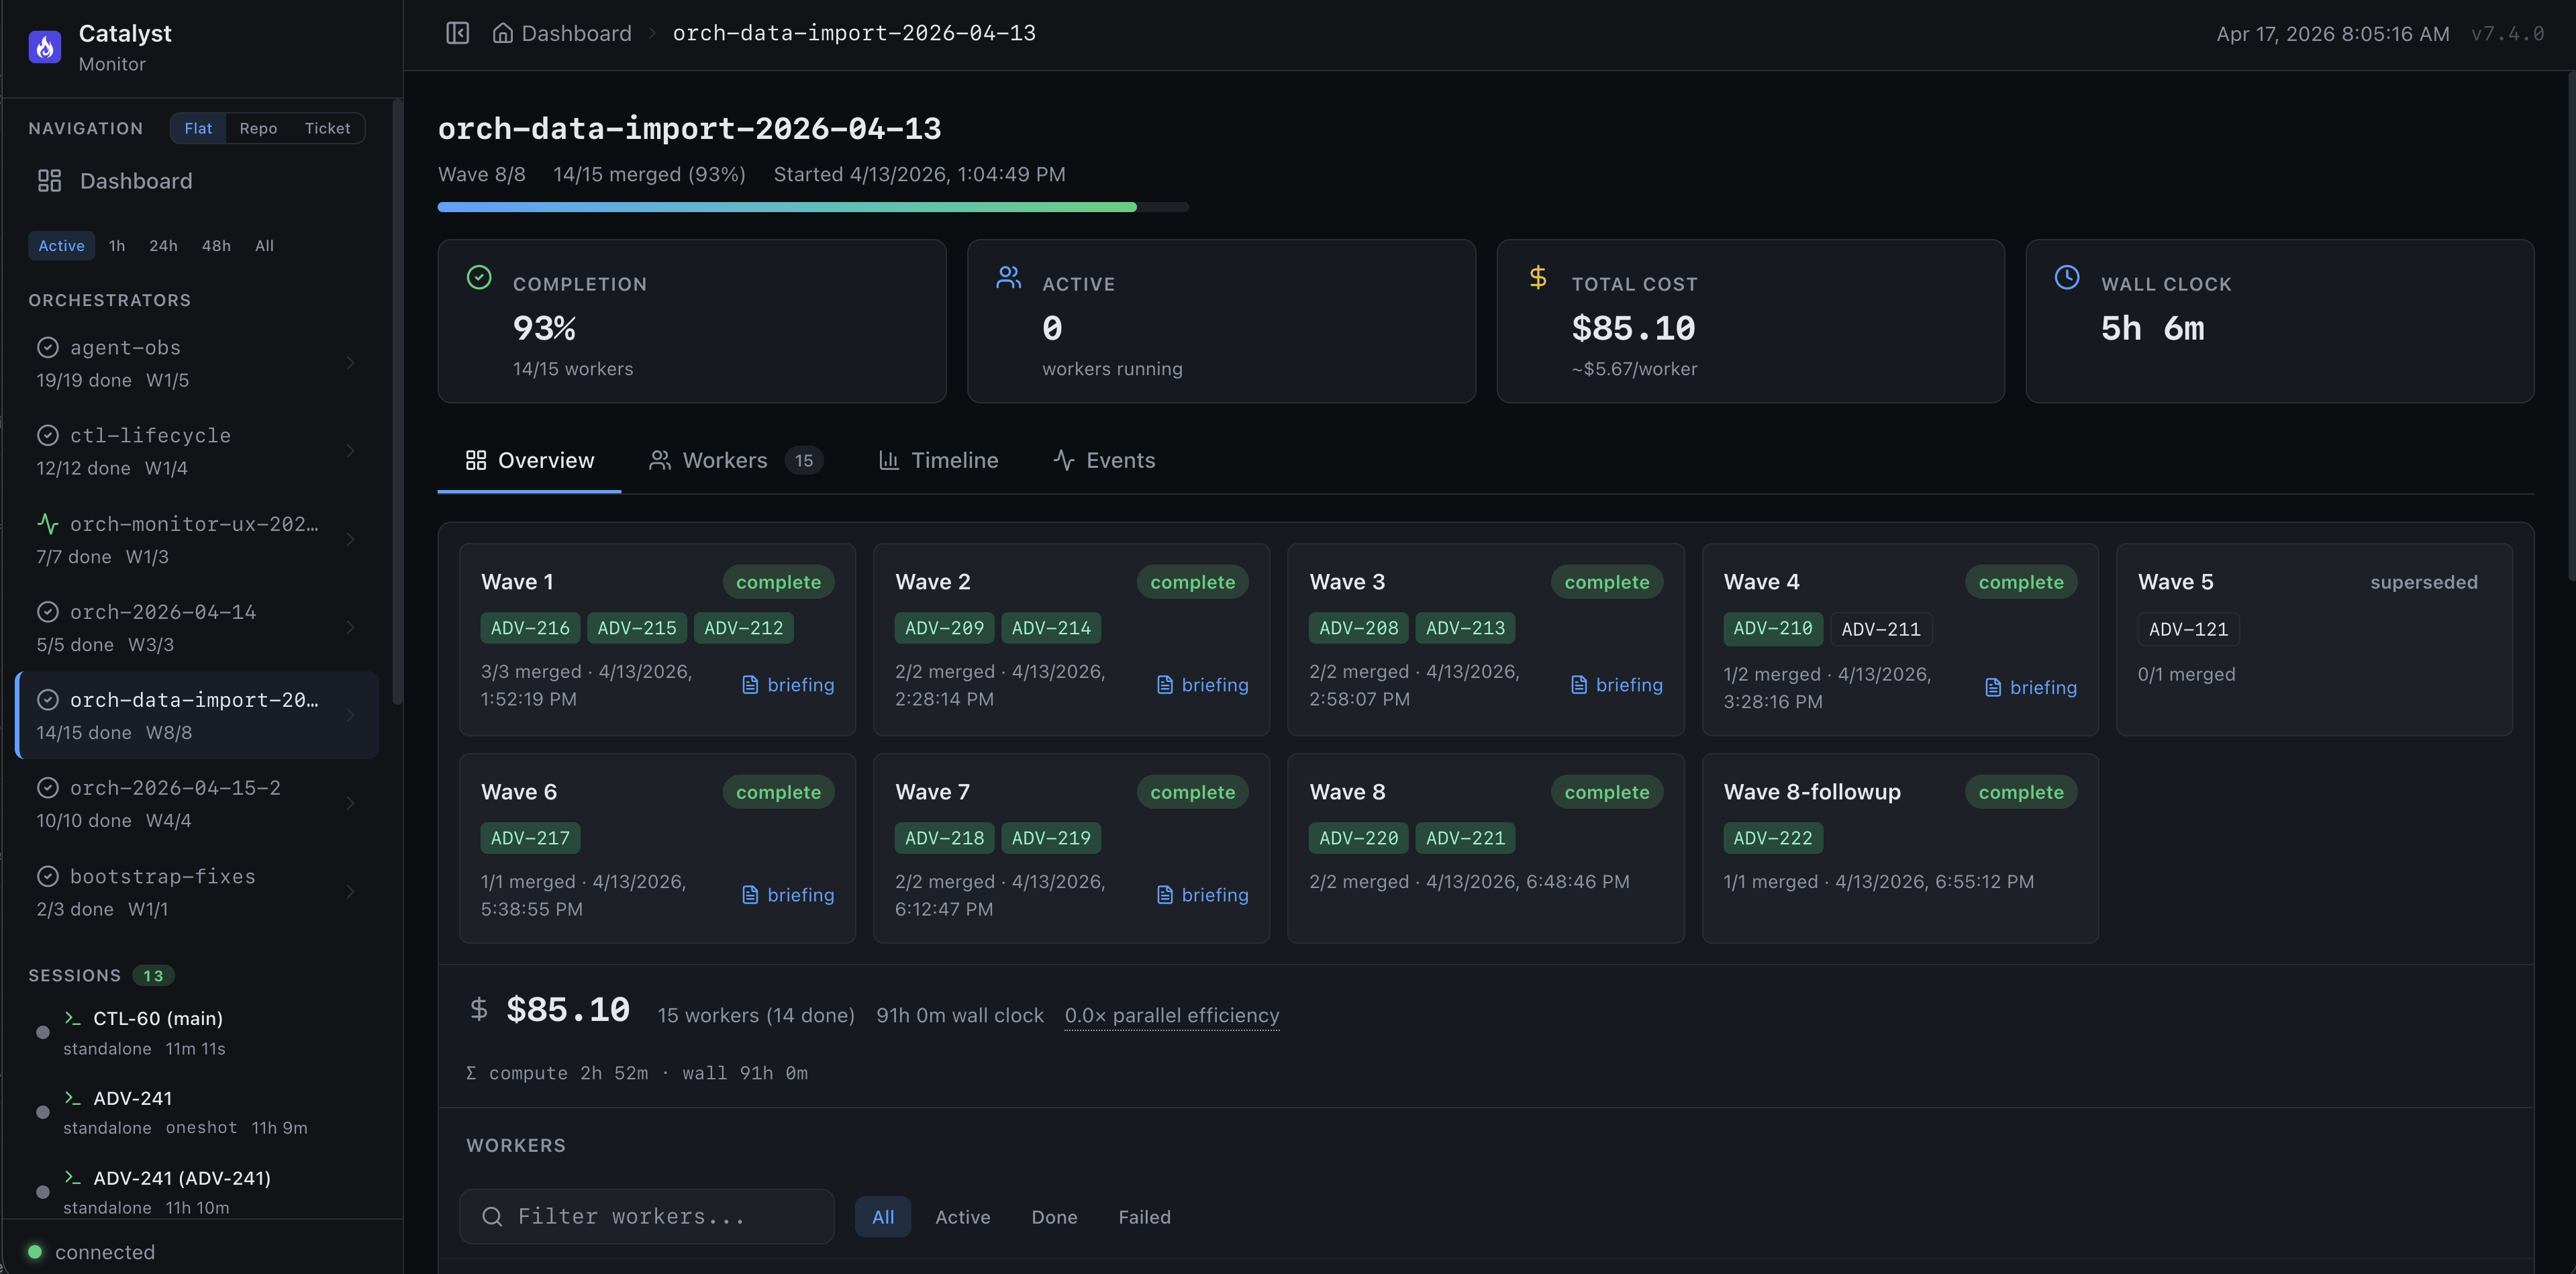
Orchestrator overview — waves, workers, cost, and wall-clock time at a glance.
Running the server
Section titled “Running the server”The simplest way to start the monitor:
bash plugins/dev/scripts/catalyst-monitor.sh startOr if you installed via the plugin marketplace:
bash ~/.claude/plugins/cache/catalyst/catalyst-dev/*/scripts/catalyst-monitor.sh startThe start command checks prerequisites (bun, sqlite3, catalyst directory), installs dependencies
and builds the frontend if needed, then starts the server in the background. Other commands:
bash plugins/dev/scripts/catalyst-monitor.sh status # Check if runningbash plugins/dev/scripts/catalyst-monitor.sh open # Start + open browserbash plugins/dev/scripts/catalyst-monitor.sh stop # Stop the serverThe server:
- Starts HTTP on port
7400(configurable viaMONITOR_PORTenv var) - Watches
~/catalyst/wt/for directories matchingorch-* - Reads worker signal files via
fs.watch— instant updates on change - Polls
gh pr viewevery 30s for each open PR - Runs
kill -0 <pid>every 5s for each known worker PID
Open http://localhost:7400 in your browser. No login, no persistence — everything is derived on the fly from the filesystem and GitHub API.
Dashboard layout
Section titled “Dashboard layout”The UI has three rows:
Row 1 — Orchestrator summary cards
Section titled “Row 1 — Orchestrator summary cards”One card per active orchestrator showing:
- Orchestrator ID + project
- Wave count (current / total)
- Worker counts: dispatched / in-progress / pr-created / done / failed
- Attention items count (red badge if > 0)
- Total cost so far (from OTel metrics, if OTel is enabled)
Clicking a card filters the rest of the dashboard to that orchestrator.
Row 2 — Worker grid
Section titled “Row 2 — Worker grid”One row per worker showing:
- Ticket (click to open Linear)
- Status color-coded: gray (dispatched), blue (researching/planning/implementing), amber (validating/shipping), green (done), red (failed)
- Phase number (0-6)
- PR (click to open GitHub) with CI status dot
- Liveness indicator: ✓ (alive), ! (dead PID), ? (no PID recorded yet)
- Duration since startedAt
- Last heartbeat (red if > 15 min)
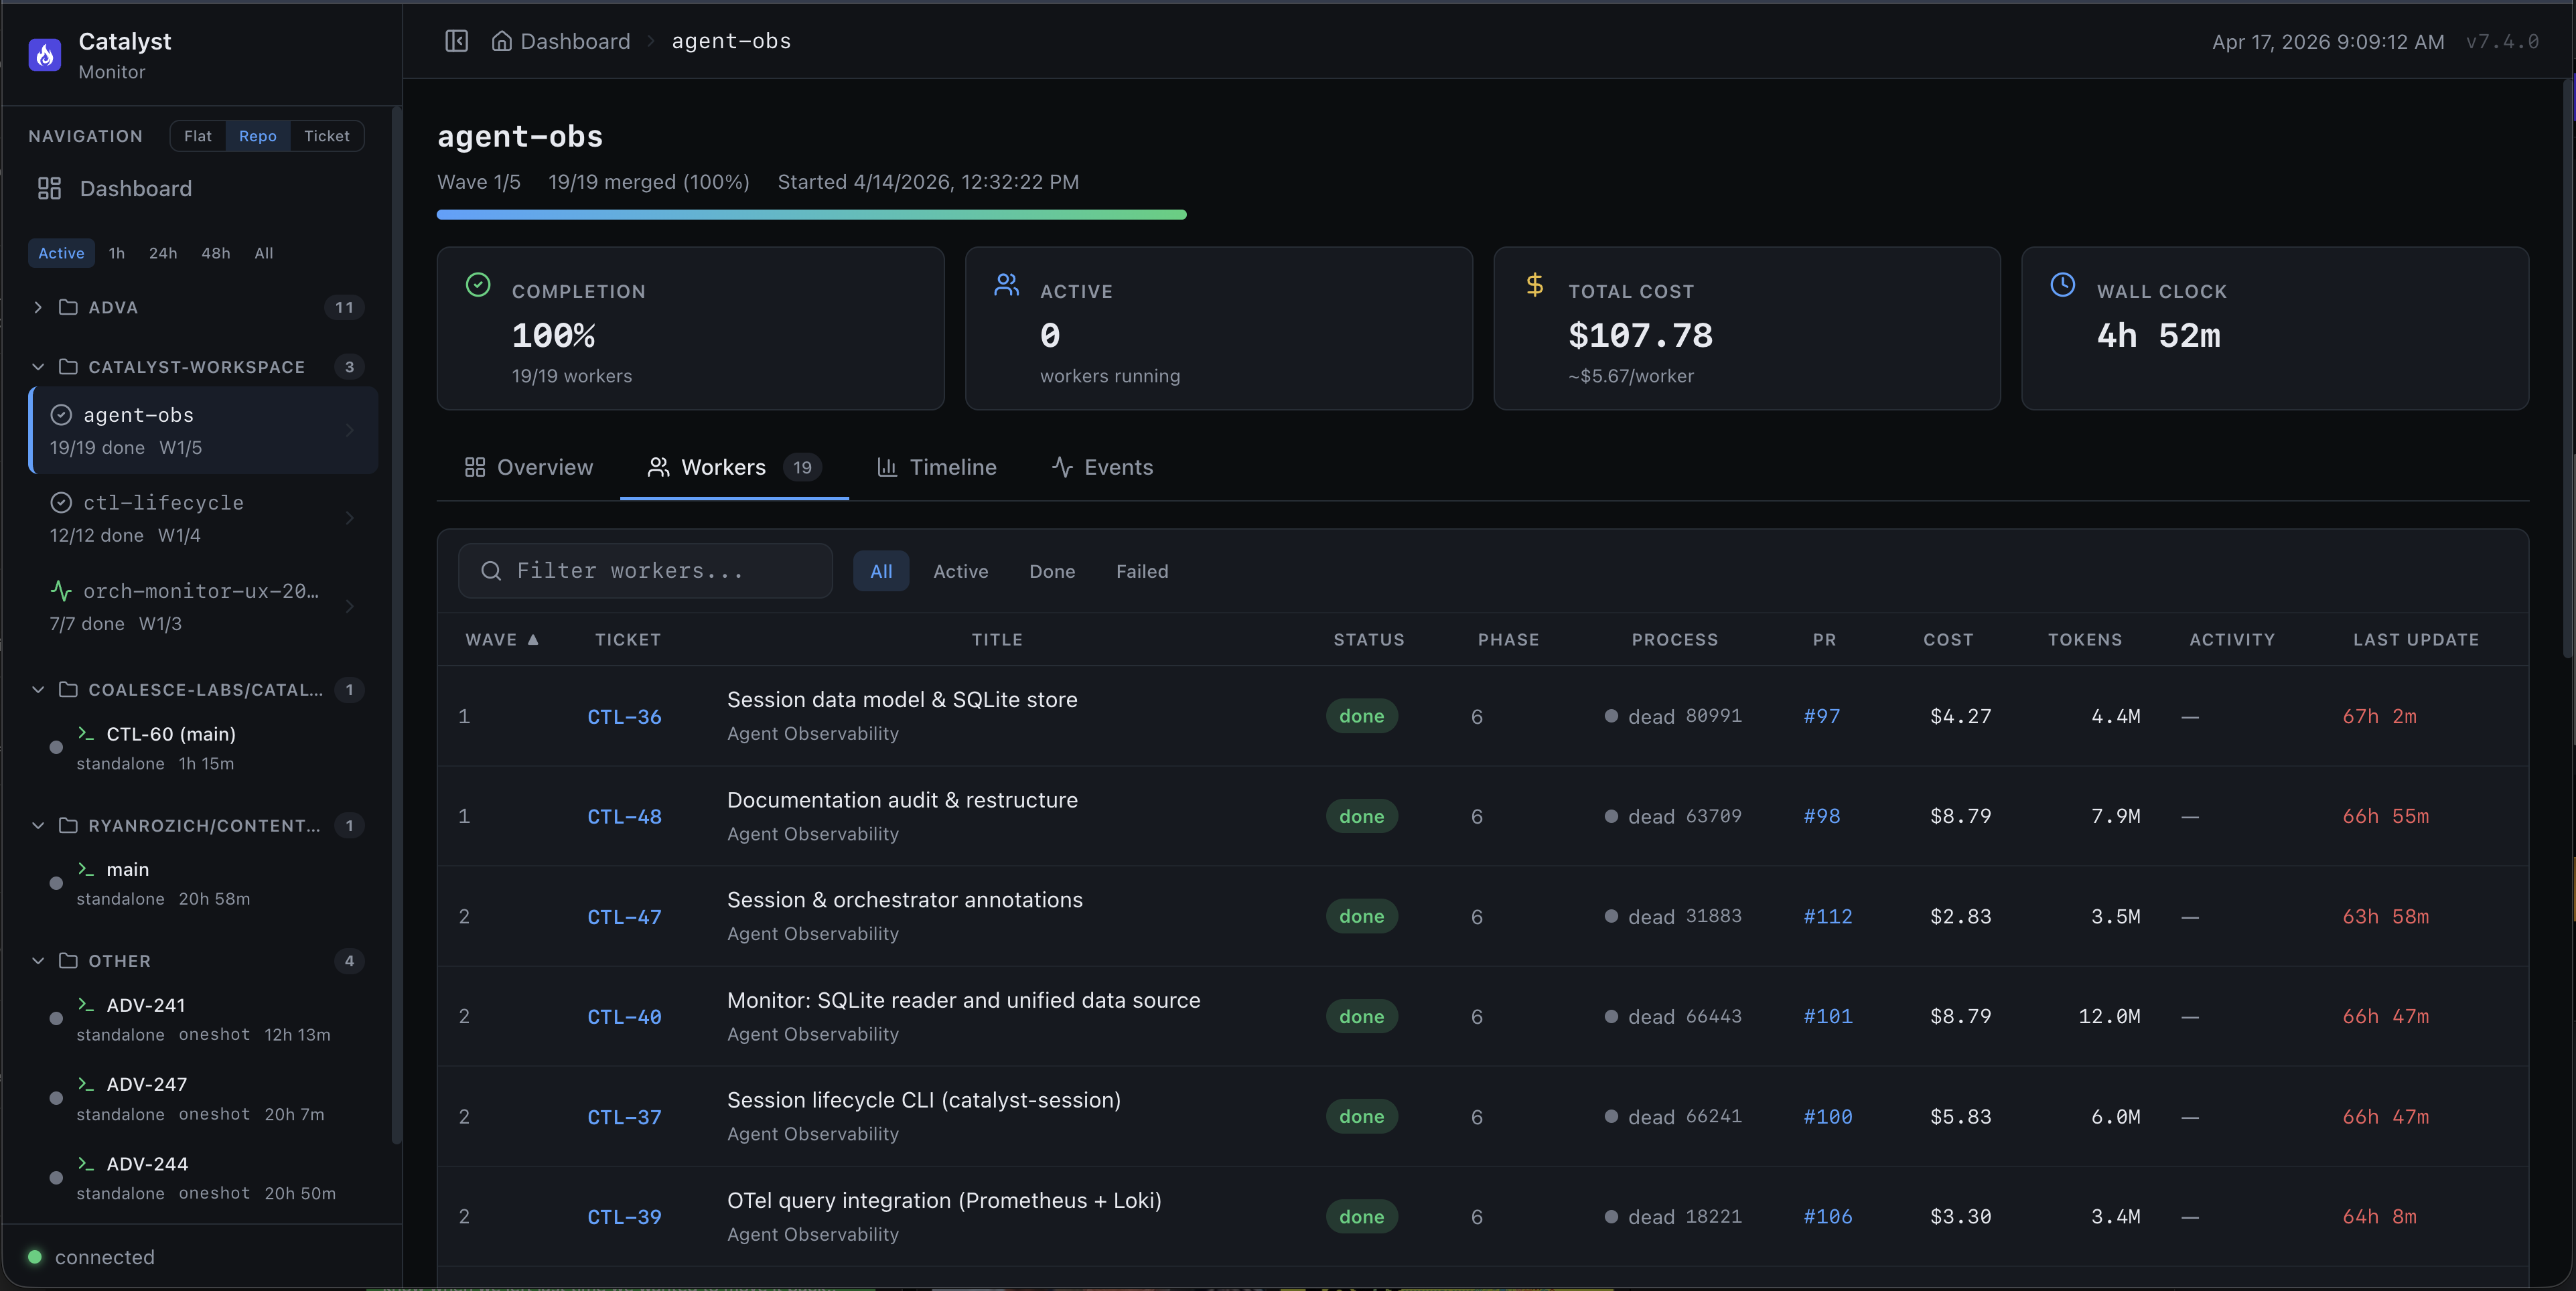
Workers tab — one row per worker with ticket, phase, PR, cost, and activity.
Row 3 — Event stream
Section titled “Row 3 — Event stream”Real-time event log from ~/catalyst/events.jsonl and filesystem watches, rendered as a timeline. Filters: event type, worker ticket, orchestrator, date range.
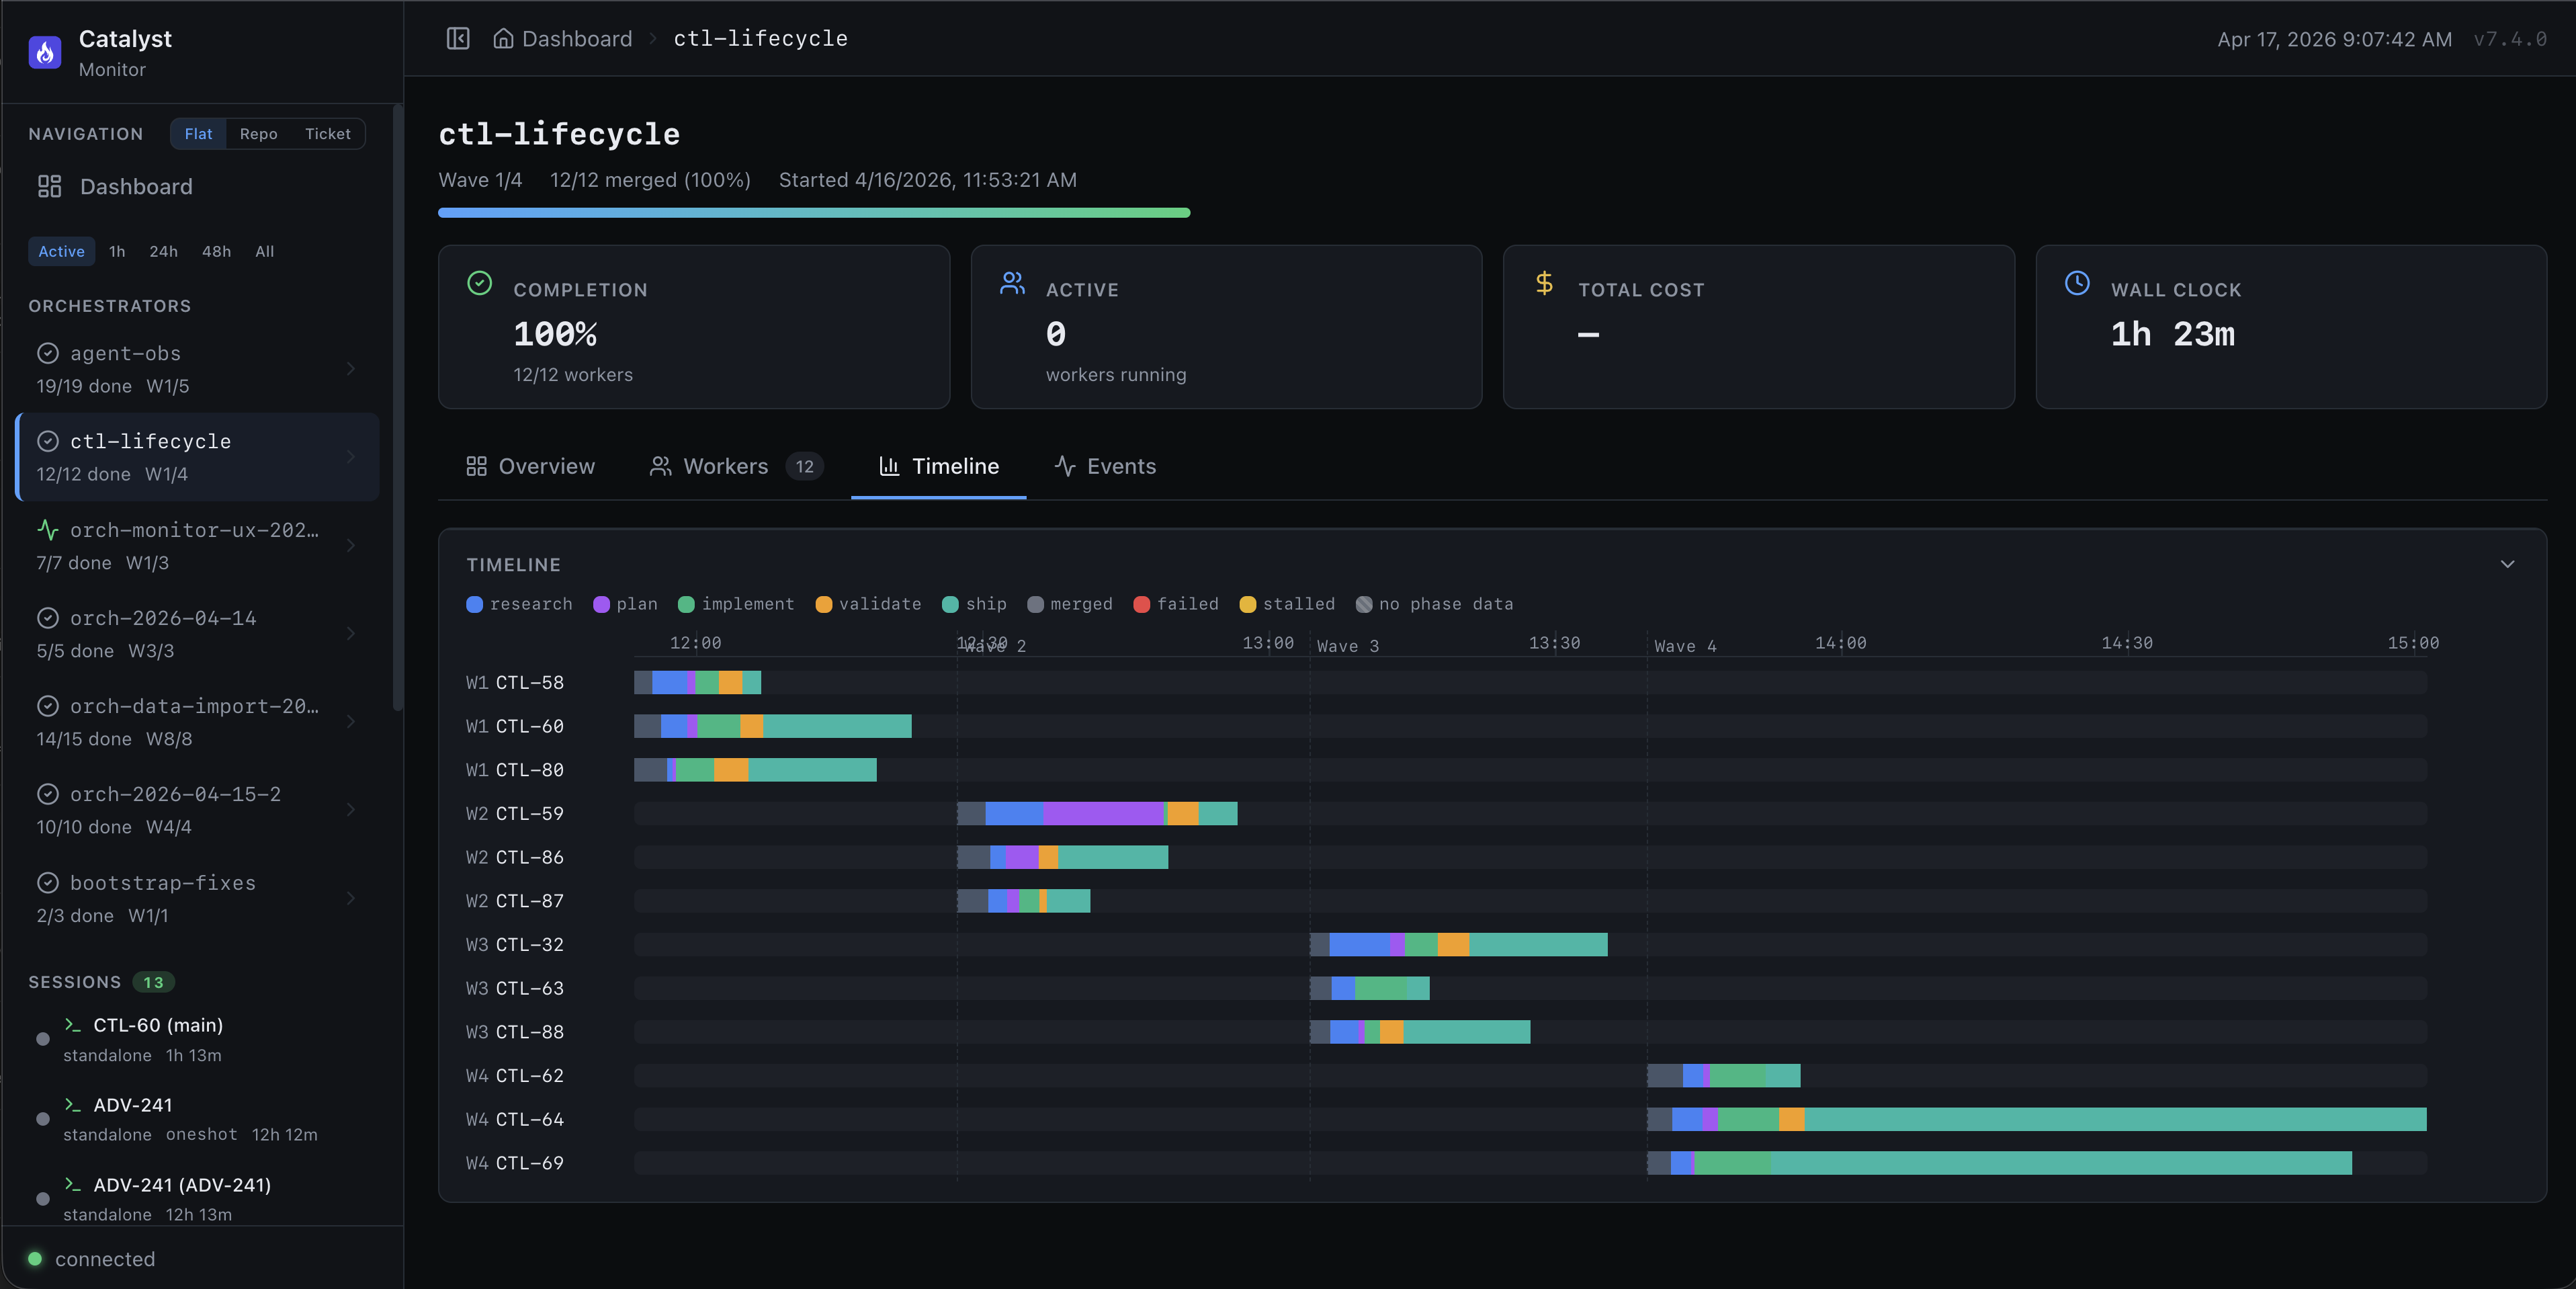
Timeline tab — phase Gantt bars per worker (research → plan → implement → validate → ship → merged).
Worker detail
Section titled “Worker detail”Click any worker row to open a detail drawer with the phase timeline, PR metadata, and the live activity feed for that ticket.
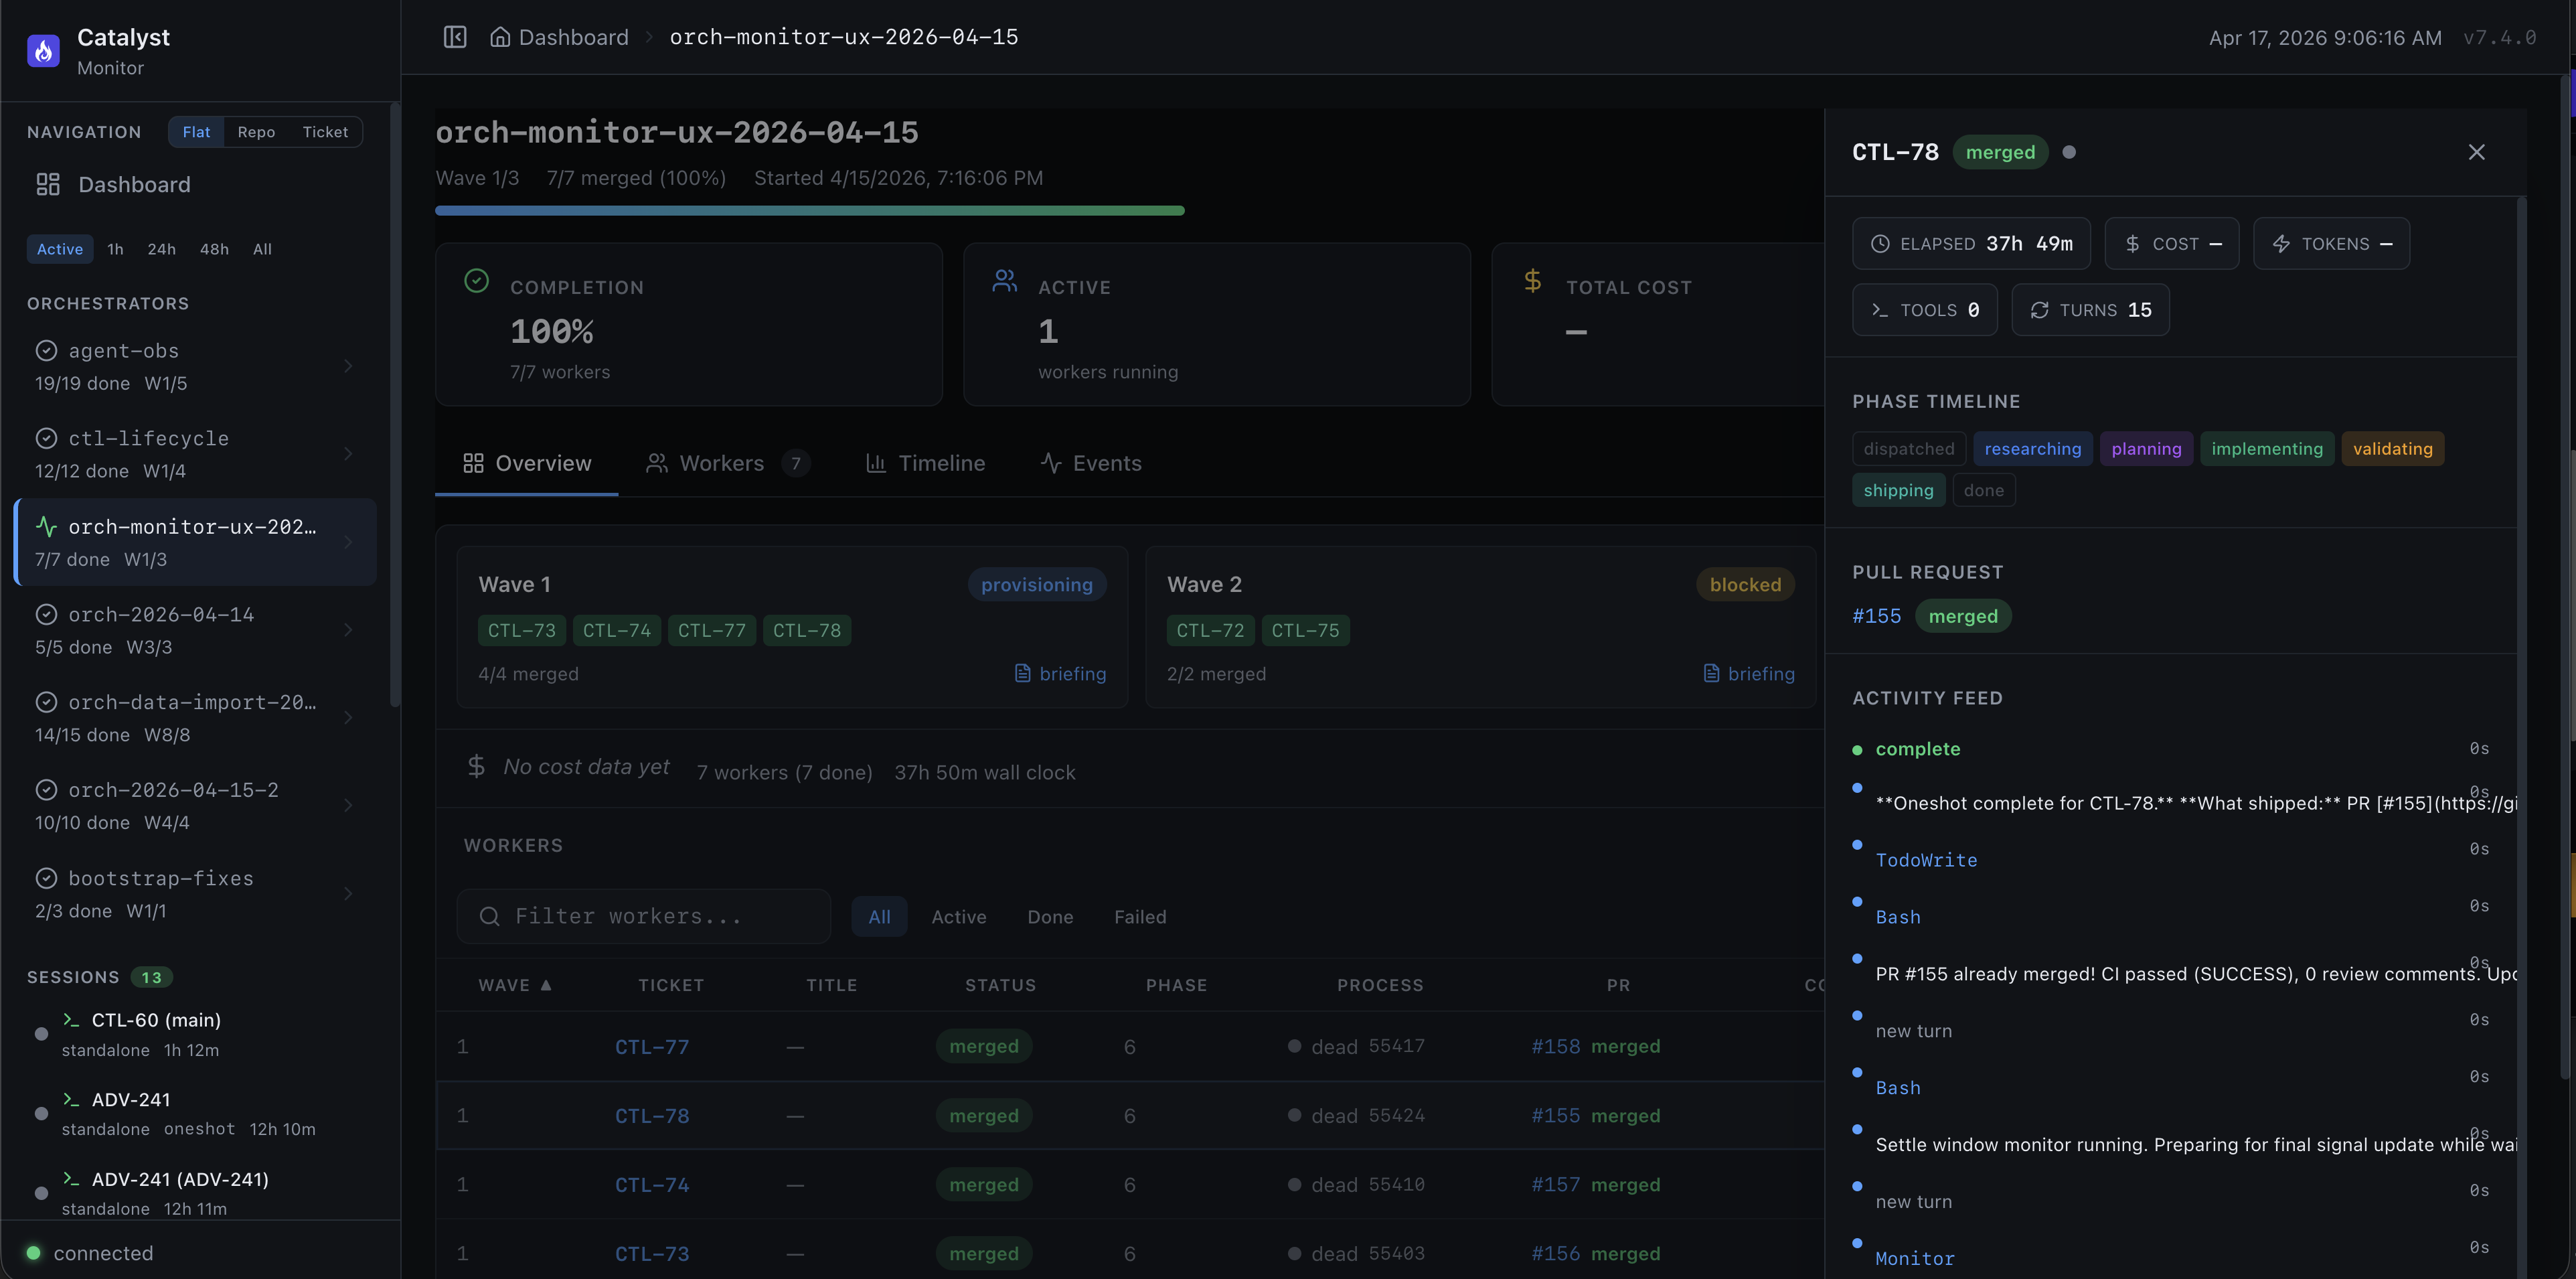
Worker detail — drill into a single ticket for its phase timeline, PR state, and activity feed.
API endpoints
Section titled “API endpoints”The monitor exposes a JSON API for programmatic access:
| Endpoint | Description |
|---|---|
GET /api/snapshot | Full current state of all orchestrators, workers, and PR statuses |
GET /api/analytics | Extended analytics including phase timelines (Gantt data) and cost breakdowns |
GET /events | SSE stream — events: snapshot, worker-update, liveness-change, pr-update |
Quick CLI status check:
curl -s http://localhost:7400/api/snapshot \ | jq '.orchestrators[].workers | to_entries[] | {ticket: .key, status: .value.status, pr: .value.pr?.number}'Stream all events to stdout:
curl -N http://localhost:7400/eventsFilters
Section titled “Filters”The web UI supports URL-based filters that persist when you reload:
?orch=orch-abc123— show only one orchestrator?status=failed,stalled— only workers in attention-worthy states?project=CTL— filter by project key
You can share a filtered URL with someone else running the same monitor — the state is all in the URL.
What the monitor does NOT do
Section titled “What the monitor does NOT do”- No persistence — close the server, lose the history (events.jsonl is the durable store)
- No auth — bind to localhost only. For team access, put it behind a reverse proxy with its own auth.
- No writes — the monitor is read-only. Remediation (re-dispatch, mark failed, merge PR) still happens via skills.
Troubleshooting
Section titled “Troubleshooting”Dashboard shows workers as “dead” but they’re still running:
The PID-liveness check uses kill -0 <pid>. If the worker is running under a different user, the check fails. The worker is actually alive — the monitor just can’t see it. Additionally, the monitor can tail the worker’s stream-json output file (workers/<ticket>-stream.jsonl) to see real-time tool calls and progress.
PR status says “merged” but the signal file says “pr-created”:
This is expected and intentional. The worker subprocess reliably exits at its last tool-use, before merge completes. The orchestrator (or the monitor itself) is the authoritative source for pr.mergedAt. The signal-file status stays at pr-created until the orchestrator updates it.
Monitor misses an orchestrator:
The monitor globs ~/catalyst/wt/*/workers/ — if your orchestrator is at a non-standard path, export CATALYST_WT_ROOT=/custom/path and restart the server.